Chicago City Model 2.0
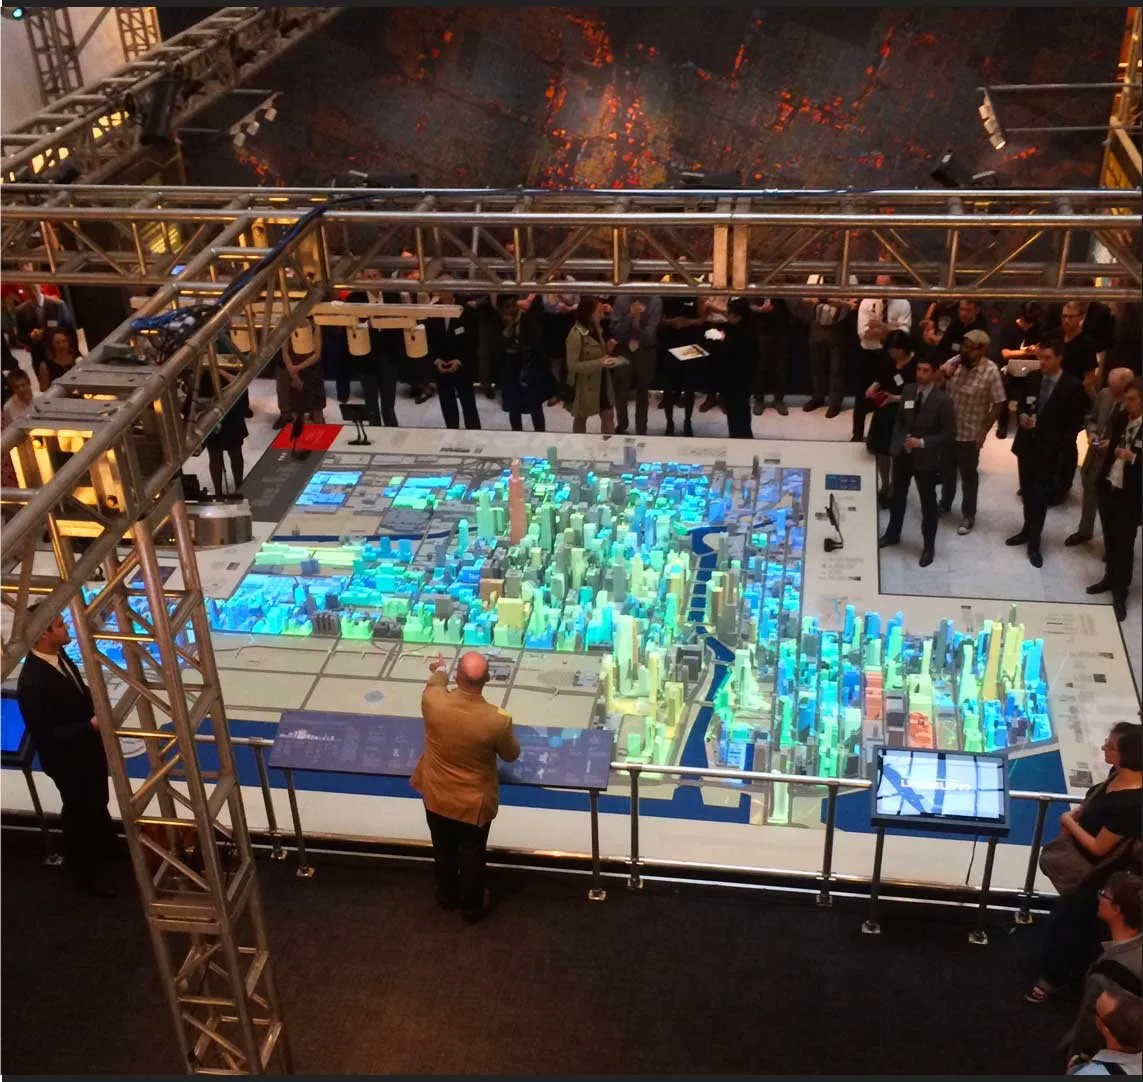
City data projected onto a 3D-printed model of downtown Chicago
A map you can walk around changes what a data set is able to say.
The Chicago Architecture Foundation kept a 3D-printed model of downtown Chicago on its exhibition floor. For Chicago: City of Big Data, the question was whether that model could stop being a static object and become an instrument: a physical surface on which the city’s public data could be read by anyone standing beside it.
City Model 2.0 is the projection-mapping platform built to do that. Six projectors, mounted in an array around the model, were synchronized to lay data sets from the city’s open data portal across its buildings and streets. Zoning, building age, electricity use, landmarks, 311 calls and other layers each became an animated state of the same physical city.
The difficulty was registration. Data arrives as flat maps; the model is thousands of small vertical surfaces. Each data set had to be rebuilt as a texture that matched the model’s digital twin, then split across six overlapping projections so that color landed on the right building from every side. The data also had to be chosen and edited, in conversation with the people who produced it, so that a visitor could read it without a legend in hand.
The platform tests a claim that runs through the Visualization as Humanistic Medium strand: that scale and medium are part of a visualization’s argument. It was developed alongside the printed City of Big Data Maps.